How to Read an Oscilloscope Screen – Things You Should Know
An oscilloscope is an essential tool for anyone working with electronic signals. It allows you to visualize and analyze waveforms by displaying voltage over time on a graphical screen. While oscilloscopes may seem intimidating at first glance, learning how to properly interpret their display is key to leveraging their analytical power. This guide will provide you with the knowledge needed to understand oscilloscope waveform readouts and extract key signal details.
What is an Oscilloscope?
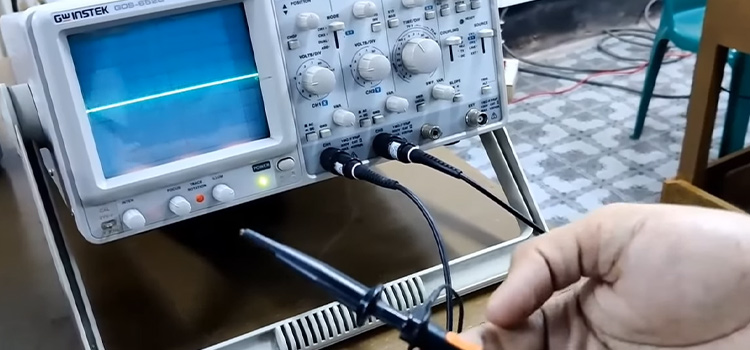
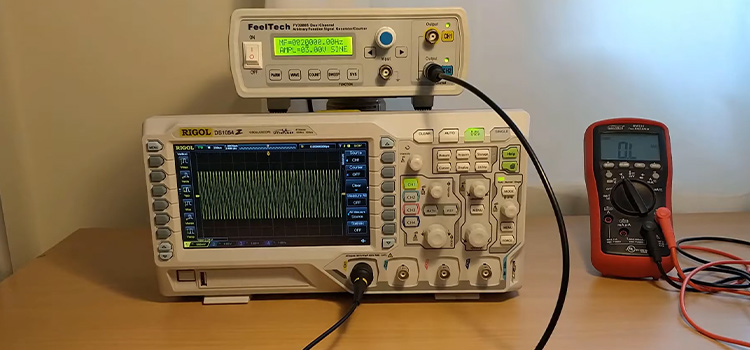
An oscilloscope is a test instrument used to graph and visualize electrical signals as waveforms. It plots a signal’s voltage over time, with the horizontal x-axis representing time and the vertical y-axis representing voltage. This creates a two-dimensional plot of the signal that allows you to see how it changes over time.
Oscilloscopes are extremely versatile tools used for designing, troubleshooting, and repairing electronic devices. Their visual display makes it easy to measure signal properties like frequency, amplitude, rise times, and noise. Modern digital oscilloscopes can analyze and decode complex signals using advanced math and signal processing techniques as well.
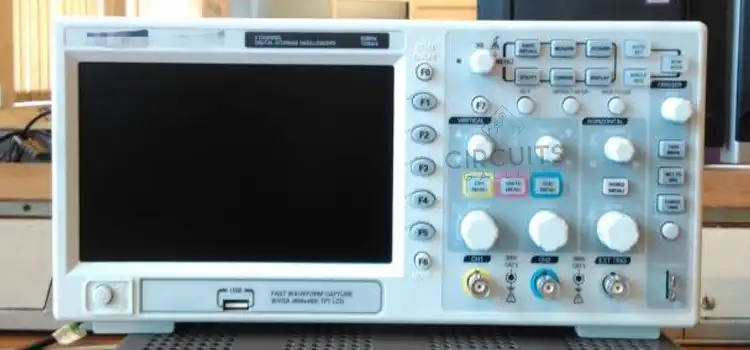
Oscilloscope Display
A basic oscilloscope display consists of an 8×10 grid of divisions with the central horizontal and vertical lines indicating the zero-volt or ground reference threshold. The number of displayed grid division squares can vary between models. Along the bottom is the time base calibrated for seconds, milliseconds, microseconds, or nanoseconds depending on settings. The vertical scale displays voltage increments.
What is Measured on the X and Y Axis of an Oscilloscope?
The oscilloscope’s x-axis represents time, while the y-axis represents voltage:
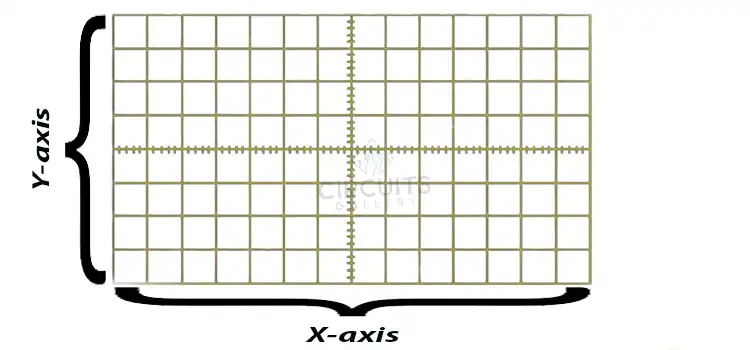
X-Axis – The horizontal x-axis shows the time base over which the waveform is displayed. Common units include seconds, milliseconds, microseconds, or nanoseconds. The total time across the scope display is called the timebase, which can be adjusted depending on the signal.
Y-Axis – The vertical y-axis shows voltage levels, typically in units like volts or millivolts. Signals with larger voltage swings or amplitudes will take up more of the vertical display. The voltage range can be adjusted with controls like gain or voltage/div.
Common Waveforms Displayed on Oscilloscope Screens
Oscilloscopes allow you to visualize many types of waveforms. Here are some of the most common you’re likely to encounter:
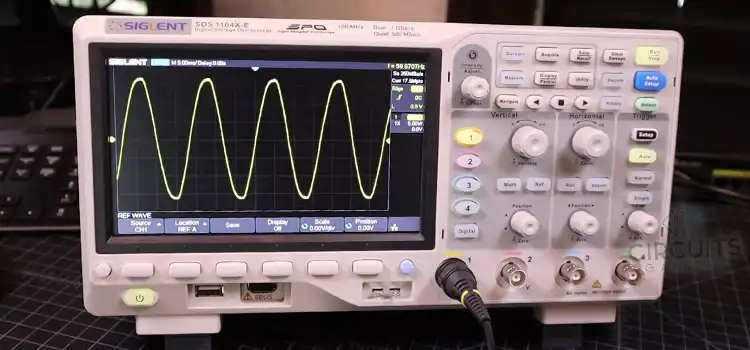
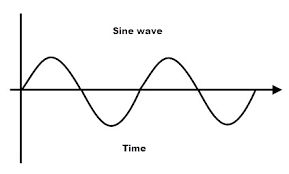
1. Sine Waves
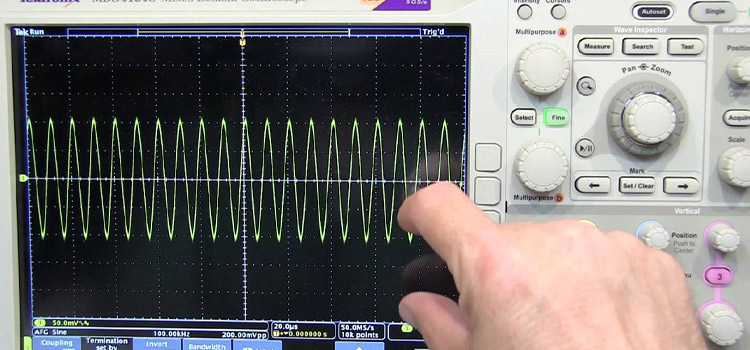
The sine wave is the most basic and pure waveform, used widely in electronics and signaling. For example, AC power supplies and radio transmitters output sine wave signals. On an oscilloscope, a sine wave will appear smooth and continuous, oscillating above and below the horizontal axis.
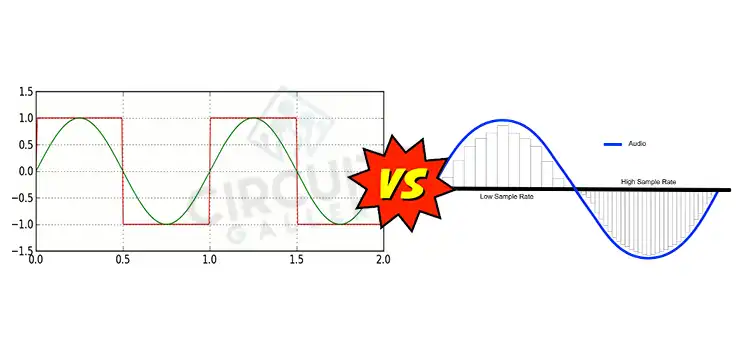
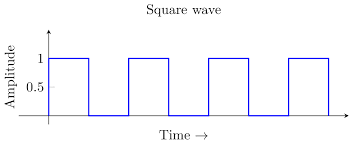
2. Square Waves
Square waves switch rapidly back and forth between two voltage levels, resulting in an on-off pattern. Digital logic circuits and timing references often output square waves. On a scope display, square waves will have straight, flat peaks with near-instantaneous transitions between levels.
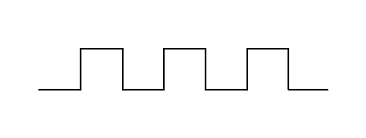
3. Rectangular Waves
Similar to square waves, rectangular waves alternate between two set voltages but with periods of time at each level before transitioning. Pulses and timing signals may have this rectangular waveform shape. You’ll see clearly discernible high and low levels displayed on the scope with slower rise/fall times than square waves.
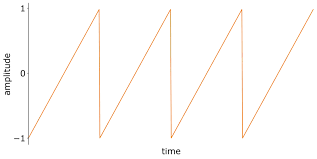
4. Sawtooth Waves
Sawtooth waves ramp up linearly to a peak voltage before dropping suddenly back to the base level. Then the ramping begins again, creating a jagged, “sawtooth” pattern. Sawtooth waves are common in power supplies and analog audio signals. On an oscilloscope, the sawtooth wave will appear much like its namesake – with a linear rise and sudden fall.
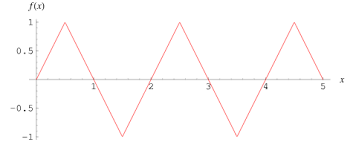
5. Triangle Waves
Triangle waves go back and forth between a top peak voltage and a bottom peak voltage in a linear manner, creating a symmetrical triangular shape. Audio electronics often use Triangle Wave. You’ll see a triangle shape on the scope, with equal periods spent rising, peaking, falling, and troughing in voltage.
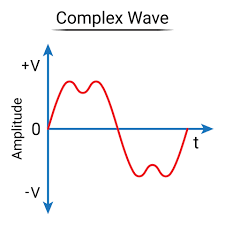
6. Complex Waves
Real-world signals are often much more complex than pure waveform shapes, appearing noisy, erratic, distorted, or irregular on an oscilloscope. Complex waves may require math analysis like Fourier transforms or data processing to interpret.
How to Read an Oscilloscope Graph
When viewing an oscilloscope display, start by taking note of key waveform details:
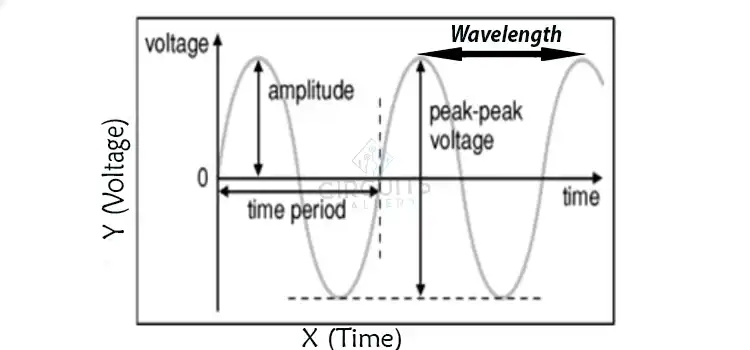
- Amplitude – The peak voltage levels and overall voltage extremes of the waveform.
- Frequency – The number of waveform cycles occurring per second.
- Period – The time duration of each waveform cycle from start to finish.
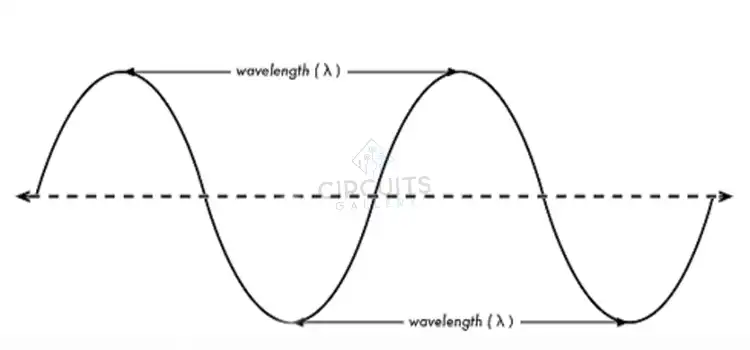
- Wavelength – The distance representing one full waveform cycle on the scope display.
Next, observe timing and voltage parameters:
- X-axis time scale – The total time duration displayed on the scope screen from left edge to right.
- Y-axis voltage range – The maximum and minimum voltages are shown from the bottom to the top of the display.
How to Measure Frequency on an Oscilloscope
The period represents the time it takes for a waveform to complete one full cycle while frequency refers to how many cycles occur per second. Here is how to measure them on an oscilloscope:
- Trigger a stable waveform trace with multiple complete cycles visible.
- Check that you have consistent typical sinusoidal waves without dropouts or noise.
- Determine the longest clean continuous sequence of cycles to measure from trough to trough or peak to peak.
- Count the number of horizontal grid line divisions covered over this sequence of cycles.
- Use the time base indicated at the bottom to calculate the total time.
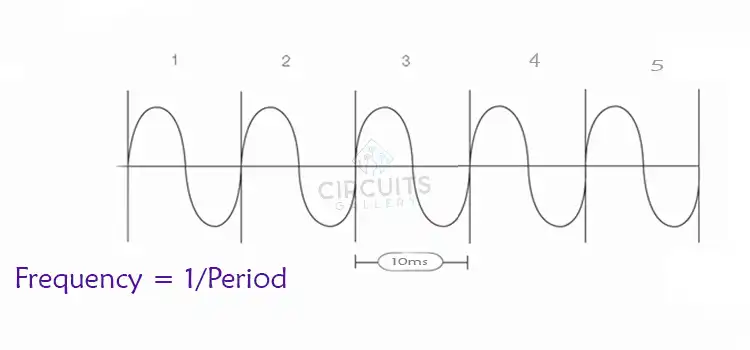
For example, if there are 5 division spans that each represent 10 milliseconds, then 5 * 10ms = 50ms. This is the period.
- To get frequency, use the relationship: Frequency = 1/Period.
In the example, 1/50ms = 20Hz frequency.
How to Measure Voltage on an Oscilloscope
The waveform on the oscilloscope shows instantaneous voltages reached at all points in time. To measure peak, average, or voltage extremes accurately:
- Set up a stable triggered waveform signal with clear peaks and troughs.
- Determine the most extreme positive or negative peak voltage level reached on a cycle.
- Compare the vertical position of this peak relative to horizontal voltage increment lines.
For instance, if using 10V divisions and the peak reaches 3 total division spans above the center threshold, then the voltage is 3 * 10V = 30V peak.
- Can also measure voltage differences like peak to peak spanning from lowest trough to highest peak vertically.
How to Measure Phase on an Oscilloscope
When dealing with multiple related waveforms, phase becomes important in determining how the timing of their signals aligns. To measure phase shift on an oscilloscope:
- Display both waveform signals on the oscilloscope screen triggered together.
- Identify correlating individual cycle peak or trough transient features that match between waves.
- Determine the time difference at these matched transient points between the two waveforms.
- Compare relative to the period to calculate phase shift as fractions or degrees.
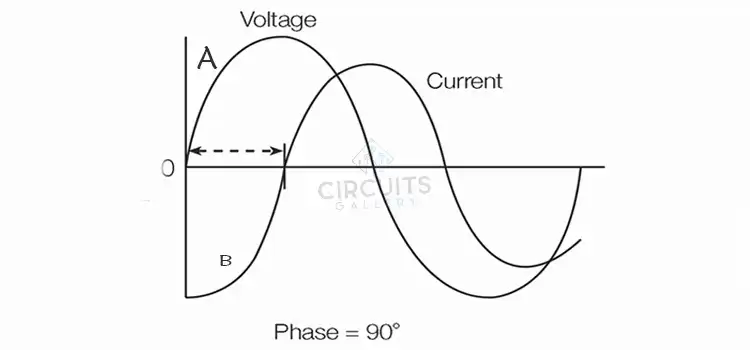
For example, if sine wave A peaks 10ms before sine wave B, but their period is 40ms, a phase shift is 10/40 = 0.25 cycles = 90 degrees.
How to Read Amplitude on an Oscilloscope
The amplitude of a waveform is the maximum voltage value reached by the signal relative to zero or the center line. It reflects the signal strength.
Measuring Amplitude
To quantify amplitude from an oscilloscope trace:
- Capture waveform containing full peak-to-peak range on display
- Set appropriate vertical sensitivity to fill oscilloscope screen height completely
- Identify absolute maximum and minimum voltage levels reached on a waveform
- Use vertical graticule lines to measure voltage values at max positive and min negative points
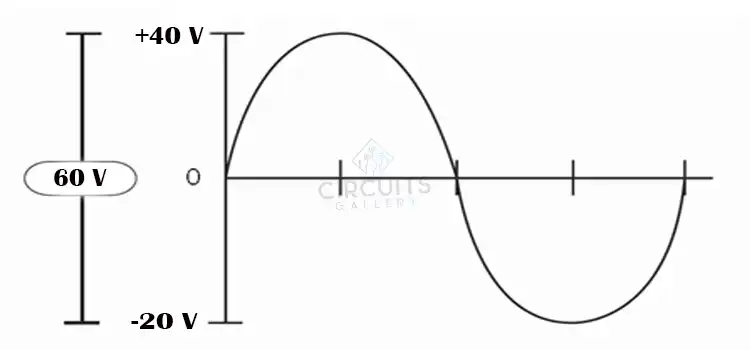
- Amplitude is the voltage difference between the maximum positive peak and minimum negative trough
Key Notes
- Amplitude measures signal envelope rather than instantaneous values
- True maximum amplitudes may be missed if sensitivity is too low
- Measure between max positive and min negative excursions for full amplitude
For example, a signal with a +40 volt peak and -20 volt trough has an amplitude of 40 – (-20) = 60 volts
Pulse Width and Rise Time Measurements on an Oscilloscope
Analyzing pulse waveforms requires quantifying key metrics like pulse width durations and transitional rise times:
Pulse Width
1. Capture a stable pulse waveform sequence on an oscilloscope using sufficient time resolution.
2. Use horizontal time grid markings to visually measure the duration from start to end of positive or negative pulse.
This provides the pulse width time value directly readable from the instrument screen in seconds.
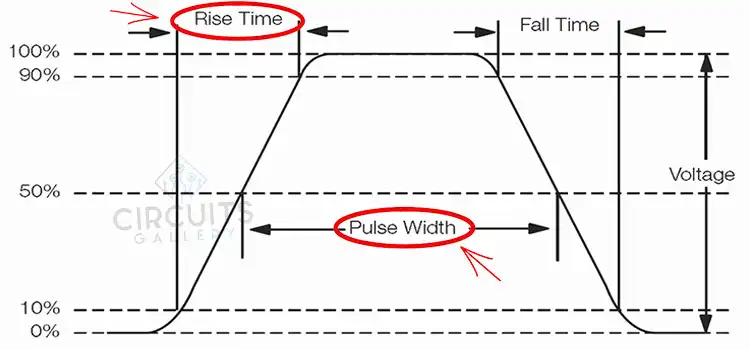
Rise Time
1. Trigger on pulse waveform edge transition with high enough time resolution to expand the rising or falling edge.
2. Use a grid to visually quantify the time taken between the lower limit (10% peak) and to upper limit (90% peak).
3. This graphical screen rise time measurement may need calibrating against instrument rise time specifications.
How to Read Duty Cycle on an Oscilloscope
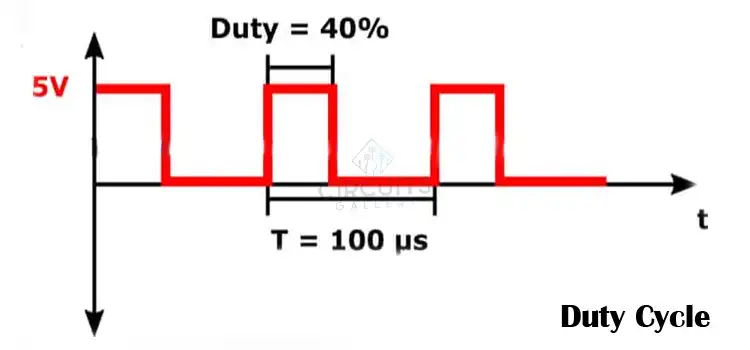
Duty cycle is defined as the proportion of time a digital periodic waveform spends at the active or high signal level relative to the entire waveform cycle period.
It can be expressed as either a ratio or a percentage:
As a ratio:
Duty Cycle = Pulse duration / Cycle period
Where,
Pulse duration – The time the signal is high during one cycle
Cycle period – The total time of one complete waveform cycle
As a percentage:
Duty Cycle (%) = (Pulse duration / Cycle period) × 100
For example, if a signal has a pulse duration of 40 μs during a cycle period of 100 μs, its duty cycle would be:
As a ratio: Duty Cycle = 40 μs / 100 μs = 0.4
As a percentage: Duty Cycle = (40/100) × 100 = 40%
Measure Wavelength with an Oscilloscope
The wavelength of an oscillator or RF signal relates to its frequency and velocity characteristics. An oscilloscope can also be used to determine wavelength:
1. Use an oscilloscope to measure frequency precisely using the period approach.
2. Record frequency value in Hz.
3. Determine, estimate, or look up the expected velocity value for the measured signal.
4. Apply wavelength formula: Wavelength = Velocity of Propagation/Frequency
5. Calculate wavelength from recorded variables.
For a 5 MHz signal traveling through coaxial cable at 2×10⁸ m/s, λ = 2×10⁸ /5×106 = 0.4m wavelength.
Beginner’s Problems and Solutions for Reading with an Oscilloscope
Here are some common beginner problems faced when measuring with oscilloscopes and potential solutions:
Fuzzy or Jumping Waveform Trace
Issue – The waveform appears thick, and indistinct with multiple traces visible jumping around.
Solution – Turn on channel triggering to stabilize waveform capture using Slope/Level controls for stable display.
Flickering Waveform Display
Issue – The entire oscilloscope waveform image flickers intermittently.
Solution – Adjust trigger holdoff settings to accurately capture cyclical signals by allowing time between captures.
No Waveform Captured
Issue – Oscilloscope shows no waveform traced out just a flat central line.
Solution – Check connections and probes attached properly to circuits. Adjust vertical scale sensitivity as needed to register voltages.
Unexpected Wave Shapes
Issue – Weird non-standard wave shapes appear showing distortions.
Solution – Set an appropriate time base to resolve signal features. Turn down or off interpolation. Check ground connections.
Wrong Frequency/Period Values
Issue – Readings for frequency, period, or timing measurements seem incorrect.
Solution – Use triggers and edge cursors properly for accuracy. Verify by physically counting cycles/timing.
Inaccurate Voltage Measurements
Issue – Quantified voltages deviate severely from expected values.
Solution – Check probe attenuation settings match channel sensitivities for accurate scaling. Calibrate probes fully.
With practice, familiarity using basic triggers, controls, and probes will help avoid many common mistakes in interpreting oscilloscope waveforms.
The Sum Up
Learning how to properly interpret the waveform displays on oscilloscope screens takes some practice but is an invaluable skill across numerous electrical engineering disciplines. Identifying fundamental shape and behavior characteristics provides significant insights into signal integrity and circuit functionality. With key measurements like voltage extremes, frequency, period, and phase alignment quantified accurately, oscilloscopes become powerful diagnostic and analytical tools for any applications dealing with electronic signals.
FAQ Corner: Answering the Burning Questions
Q1. How can you determine the period of a waveform using an oscilloscope display?
To measure the period on an oscilloscope, you should trigger a stable waveform trace with multiple complete cycles visible. Count the number of horizontal grid line divisions covered over the longest clean sequence of cycles from peak to peak or trough to trough. Then use the time base indicator at the bottom to calculate the total time across that sequence of cycles. This gives you the period.
Q2. What is the difference between the period and frequency of a waveform?
The period is the time taken for one complete cycle of the waveform to occur. It is measured in units of time like seconds. Frequency refers to how many cycles occur per second – it is measured in Hertz. They are related by: Frequency = 1/Period
Q3. What should you look for on a waveform to identify distortion issues?
Look for inconsistencies and irregularities in the waveform shape and cycles. This includes clipping of peaks, rounding and flattening of curves, stretches, and compressions on certain portions of a wave, and spikes or glitches occurring sporadically. These indicate distortion and signal integrity problems.
Q4. How do you properly measure peak-to-peak voltage on an oscilloscope display?
Set up a stable triggered single-shot capture showing the waveform. Identify the most extreme positive peak voltage reached and the most extreme negative voltage trough on the waveform. Use the vertical voltage increment calibration lines to quantify each of these values. Peak-to-peak voltage is the difference between the lowest negative trough voltage and highest positive peak voltage values.
Q5. How Do You Read an Oscilloscope Clock?
You can measure time like how you measure amplitude. Just count the number of horizontal divisions and multiply that number by the horizontal scale setting. You may use this to determine the signal’s period. The waveform occupies 2.5 horizontal divisions for each cycle.
Q6. Is an oscilloscope a voltmeter?
Oscilloscopes do not all function as voltmeters. Depending on the oscilloscope type. In general, a Cathode Ray Oscilloscope (CRO) oscilloscope may be seen as a voltmeter. The possible differences between the two points may be measured using this.
- What is an Oscilloscope?
- Oscilloscope Display
- What is Measured on the X and Y Axis of an Oscilloscope?
- Common Waveforms Displayed on Oscilloscope Screens
- How to Read an Oscilloscope Graph
- How to Measure Frequency on an Oscilloscope
- How to Measure Voltage on an Oscilloscope
- How to Measure Phase on an Oscilloscope
- How to Read Amplitude on an Oscilloscope
- Pulse Width and Rise Time Measurements on an Oscilloscope
- How to Read Duty Cycle on an Oscilloscope
- Measure Wavelength with an Oscilloscope
- Beginner's Problems and Solutions for Reading with an Oscilloscope
- The Sum Up
- FAQ Corner: Answering the Burning Questions
Subscribe to our newsletter
& plug into
the world of circuits