How to Draw (Plot) A Circle Using Matlab
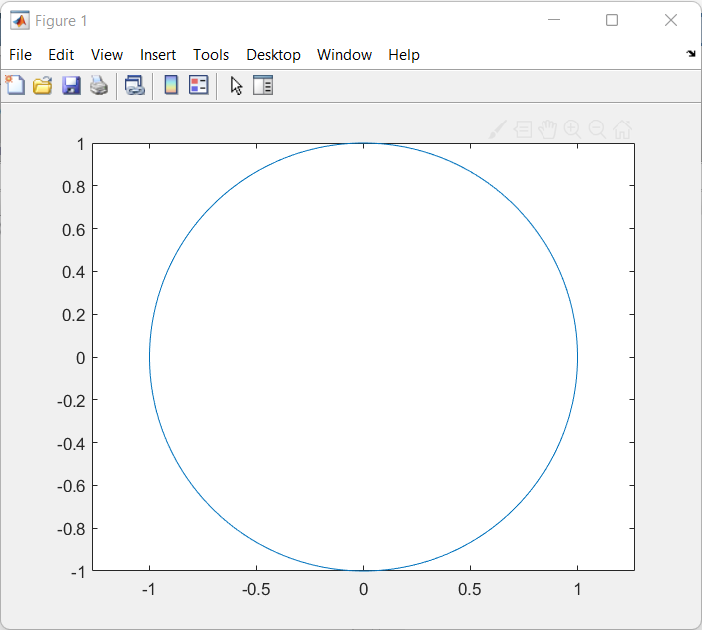
How to draw a circle in MATLAB? This is a commonly asked question from many MATLAB beginners. Here is the MATLAB code to plot a circle. The transfer characteristics between the sine wave and cosine wave will give a circle. So here first we define sine and a cosine wave, then plotting a circle in MATLAB becomes so simple, just plot the sine Vs Cosine. Following are the codes for the MATLAB circle plot. The codes are well commented on for easy interpretation.

Matlab Circle Codes
clc;
clear all;
close all;
t=0:0.001:1;
s=sin(2*pi*2*t);
c=cos(2*pi*2*t);
plot(s,c);%Plotting sin Vs cos
axis('equal');%Equal length fox X and Y axis
The Output of Matlab Circle Code
Conclusion
A circle can also be plotted using the concept of polar coordinates. But using sine and cosine trig functions in this regard is a brilliant idea, and exceptional indeed.
Table Of Contents
Subscribe to our newsletter
& plug into
the world of circuits
![What Causes a Capacitor to Explode? [6 Reasons]](https://www.circuitsgallery.com/wp-content/uploads/2023/06/What-Causes-a-Capacitor-to-Explode.webp)
![[Explained] What Gauge Wire for Doorbell?](https://www.circuitsgallery.com/wp-content/uploads/2023/12/What-Gauge-Wire-for-Doorbell.webp)


![How Much Copper Is In A Transformer [Answered]](https://www.circuitsgallery.com/wp-content/uploads/2023/09/How-Much-Copper-Is-In-A-Transformer.webp)
how about hyperbola
Here’s an example of MATLAB code to plot a hyperbola and its asymptotes:
% Define parameters
a = 2; % Semi-major axis
b = 1; % Semi-minor axis
center = [0, 0]; % Center of the hyperbola
% Generate points for the hyperbola
theta = linspace(0, 2*pi, 1000);
x = a * cosh(theta);
y = b * sinh(theta);
% Plot the hyperbola
figure;
plot(x, y);
hold on;
plot(x, -y); % Other branch of the hyperbola
% Plot asymptotes
asymptote1 = (b/a) * x;
asymptote2 = -(b/a) * x;
plot(x, asymptote1, ‘–‘, ‘Color’, [0.5 0.5 0.5]);
plot(x, asymptote2, ‘–‘, ‘Color’, [0.5 0.5 0.5]);
% Set axis labels and title
xlabel(‘x’);
ylabel(‘y’);
title(‘Plot of a Hyperbola and Asymptotes’);
% Set axis equal and grid
axis equal;
grid on;
% Add legend
legend(‘Branch 1’, ‘Branch 2’, ‘Asymptotes’);
% Show the plot
hold off;
In this code, we first define the parameters of the hyperbola, such as the semi-major axis a, semi-minor axis b, and center coordinates. We then generate points for the hyperbola using the parametric equations of the hyperbola in terms of cosh and sinh functions. We plot both branches of the hyperbola along with their asymptotes.
You can modify the parameters a and b to change the shape of the hyperbola. Running this code in MATLAB will produce a plot of the hyperbola and its asymptotes.