How to Plot a 2d Function in MATLAB? Basic Steps for MATLAB Plotting
You can easily plot different functions using MATLAB. To plot a 2D function in MATLAB you must first choose an independent variable. Let it be ‘x’. This variable will form an axis of the plot, more likely the horizontal or x-axis. The vertical component of the plot is then found by using the function of this independent variable.
Each point in the plot has a vertical and horizontal component. First, the independent variable and its range must be defined. At the same time, the number of points to be used in the plot can also be declared.
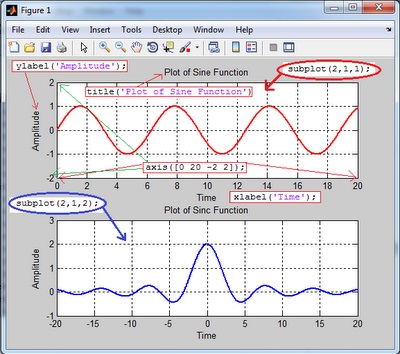
For example, we are going to plot the ‘Sine’, and the ‘Sinc’ function. The program is self-explanatory. We added some labels to the plotted graph to make clear the programming steps.

Program for How to Plot a 2d Function in MATLAB
Clear all;
clc;
close all;
set(0,'defaultlinelinewidth',2); %Intensity of lines
t=-100:.005:100; %Time Samples from -100 to 100 with an interval of 0.005
s=sin(t); %Assigning Sin(x) to a variable 's'
subplot(2,1,1); %The ploting frame divided in to 2 rows and this fig appear at first
plot(t,s,'R'); %Plotting 't' on X-Axis Vs 's' on Y-Axis,'R' indicate the Colour 'RED'
title('Plot of Sine Function');%Title of the plot
xlabel('Time'); %Name of X-Axis
ylabel('Amplitude');%Name of Y-Axis
axis([0 20 -2 2]); %X-Axis varies from 0 to 20 and Y-Axis from -2 to 2
grid on; %Enable Grid lines
z=2*sin(t)./t; %Assigning Sin(x)/x to a variable 'z'
subplot(2,1,2); %To ploting frame divided in to 2 rows and this fig appear at second
plot(t,z,'B'); %Plotting 't' on X-Axis Vs 'z' on Y-Axis,'B' indicate the Colour 'BLUE'
title('Plot of Sinc Function');%Title of the plot
xlabel('Time'); %Name of X-Axis
ylabel('Amplitude');%Name of Y-Axis
axis([-20 20 -1 3]);%X-Axis varies from -20 to 20 and Y-Axis from -1 to 3
grid on; %Enable Grid lines
Plotted Output
Conclusion
This guideline provides the answer to how to plot a 2d function in MATLAB for any graph you need. Sine and Sinc are used as instances since they are the most familiar ones within the engineering community.
Subscribe to our newsletter
& plug into
the world of circuits


